
HOW CM CURRENT AFFECTS A DIPOLE WITH A BALUN
On the previous page we saw how much Common Mode Current affects a dipole that has no balun.
On this page we shall see how adding a 1:1 current balun to the dipole changes things. We will first look at a dipole with a Maxwell (W2DU) balun, and then a dipole with a Guanella balun.
Before we begin, let's review the difference between a Maxwell balun and a Guanella balun:
A 1:1 Maxwell Balun:

Whereas the Maxwell balun (above) uses several ferrite beads over coax, the Guanella balun (on the right) uses transmission line wound over a ferrite Toroid. The transmission line may be of coax, bifilar wire, or twisted-pair wire. The Guanella may be cross-wound (as shown here) or wound with all turns in one direction. (Both examples are courtesy of Spiderbeam.)
Most 1:1 Guanella baluns are built like the balun shown in the photo on the right above, either with coax, bifilar or twisted pair. However when I ran my 2013 Common Mode Current Field Test, I used a 1:1 Guanella balun as designed by Wolfgang Wippermann, DG0SA (SK), shown here on the right.
This balun has two bifilar transmission lines, with each wound on opposite sides of the Toroid. Their impedance is 100 Ohms. Since they are wired in parallel, the balun's impedance is 50 Ohms.
This type of balun is relatively broad-banded exhibiting a Common Mode Impedance of 30dB or more across the HF spectrum.
1:1 Guanella Balun


Like with the dipole without a balun (shown on the previous page) with a short piece of coax run straight down the pole, the measured Common Mode Current was so low that it is not even worth showing the SWR curve graph. It is just a typical dipole SWR curve.
I will only show graphs with the coax length 95% of a full physical wavelength. I will contrast it to when it is running at a 90 degree angle away from the pole to when it is radically skewed to one side of the pole. Note: I skewed it first to one side and measured, then to the other side and re-measured. Basically there was no difference between the two skewed configurations.
A 40m DIPOLE WITH A 1:1 MAXWELL CHOKE-BALUN
Note: For this test I used the exact same dipole (no balun) as used on the previous page, but inserted the Maxwell Choke-Balun between the coax and the feedpoint. I also shortened the length slightly to move minimum SWR near the middle of the band.

FIG.1: Without a balun, there was slightly more CM Current on the feedline than with a balun (i.e, 30mA vs 24mA). When the system was grounded, the CM Current was 60mA in both cases. The SWR curves are nearly identical.

With the coax radically skewed to either side, Common Mode Current is induced into the feedline.
FIG.2: With a Maxwell Choke-Balun (C1) inserted at the feedpoint and the system floating, CM Current has increased slightly, because there really is no low impedance path to ground. When the system is grounded (i.e., through the A.C. mains ground), a low impedance path to ground is established and Common Mode Current is increased significantly. How much depends on how good (or poor) the balun or choke at the feedpoint is.
A 40m DIPOLE WITH A 1:1 Guanella CHOKE-BALUN
The DG0SA Balun used in this test is a modified Guanella Choke-Balun.

With the coax straight at a 90 degree angle (Fig.3), there is basically no difference (i.e., just 8mA) whether the system is floating or grounded - again due to there being no low impedance path to ground along the coax. In this case the balun has enough Common Mode Impedance to impede the small amount of CM Current that would otherwise be generated at the feedpoint.
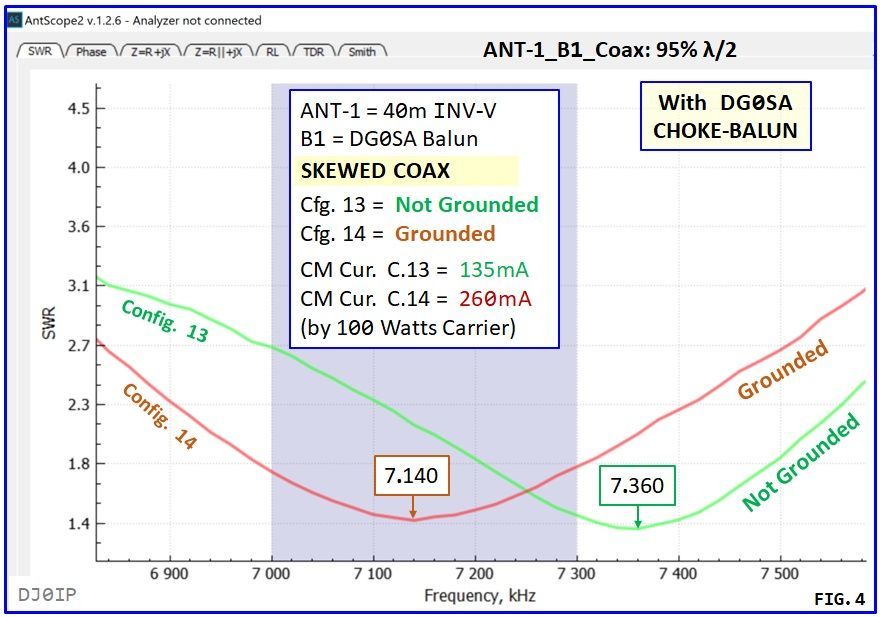
I found the graph in FIG.4 above to be 'curious'. As a Sanity-Check, I examined the original data again (FIG.5 below), taken with the antenna rotated 180 degrees. To distinguish this configuration, I named it "ANT-1-B1-REV." I also used the original version of AntScope software to look at the curves. As you can see in the graph below, it is identical to the graph above. The vertical scale is shown differently, but the values along the curves are identical.
In both cases, significant CM Current is flowing. Curious: why is there more CM Current floating when not grounded than when grounded. I would have expected just the opposite.

This "Sanity-Check" (FIG.5) confirms that the graph above it is correct.
Now let's look at all four curves on a single graph and 'try' to understand it:

As can be seen in FIG.6, when the system is grounded, the DG0SA balun skews much higher in frequency than the other curves.
IMO this is a clear indication of lots of Common Mode Current on the feedline - BUT THIS IS ONLY A HUNCH. Further testing will be made to study this.
Until I can repeat this test with a standard 1:1 Guanella balun wound with coax and compare to these curves, I will NOT use the DG0SA balun for anything!
DOWNLOAD DATA FILES:
Note: The following files are in the ".asd" format for viewing with the Freeware Software "AntScope-2". These files are zipped/rar because my web will not accept .asd files for the download.